
For e-commerce sellers sourcing from China and selling on Amazon, Temu, and similar platforms, the return rate is the single largest hidden cost. One of our clients — a Germany-based brand selling smart LED lighting fixtures — was shipping 12,000 units per month with a sustained return rate of 10% to 12%. That level of returns was erasing most of their profit margin. They came to us to find out why.
The Hidden Cost of Returns — Why Pre-Shipment Inspection Matters
Amazon sellers typically see return rates of 3% to 15%, with electronics categories skewing even higher. Each returned unit costs the seller not only the lost sale but also reverse logistics, warehousing fees, and disposal charges. For a $36 smart LED fixture, a single return can cost $8 to $12. At 1,200 returns per month, that is over $10,000 in monthly losses — before accounting for negative reviews and account health impacts.
When the return rate hits 12%, pre-shipment inspection (PSI) is no longer an optional step — it is a margin-protection necessity. The math is simple: catching a defect at the factory in China costs roughly 10 times less than dealing with a return after the goods have reached an overseas warehouse. A single pre-shipment inspection costs approximately $188, yet it can prevent thousands of dollars in defective inventory from ever reaching customers.
Pre-Shipment Inspection Benefits — Real-World Case Data
We provided three months of continuous pre-shipment inspection service for this LED lighting client, sampling 2–3 batches each month. Here are the key defect categories we uncovered and their measured impact on the return rate:
| Defect Category | Initial Defect Rate | After Correction | Return Impact |
|---|---|---|---|
| Color Temperature Deviation (±300K) | 40% | 5% | #1 Return Driver |
| Packaging Defects (Crush/Tear) | 15% | 2% | #2 Return Driver |
| Coating/Finish Imperfections | 8% | 1.5% | Negative Reviews |
| Missing Accessories | 5% | 0.5% | Customer Dissatisfaction |
The single most impactful finding was color temperature deviation: 40% of units showed a shift exceeding 300K from the labeled value — a difference visible to the naked eye. An end consumer who expected a 'warm white' 3000K bulb received something closer to cool white (3300K+), leading directly to negative reviews and returns. The factory, operating without a calibrated integrating sphere, had no way to detect this. Our China inspection team measured every sample with a handheld spectrometer — the entire test takes under a minute per unit.
Three-Month ROI of Pre-Shipment Inspection
After three months of consistent PSI inspection and corrective action tracking, here is how the client's return rate evolved:
| Month | Return Rate | Monthly Returns (based on 12,000 units) | Estimated Monthly Loss |
|---|---|---|---|
| Month 0 (Baseline) | 12% | 1,440 units | $11,520 – $17,280 |
| Month 1 | 7.5% | 900 units | $7,200 – $10,800 |
| Month 2 | 4.2% | 504 units | $4,032 – $6,048 |
| Month 3 | 2.8% | 336 units | $2,688 – $4,032 |
From 12% to 2.8% — a 77% reduction in returns. Even after deducting approximately $1,000 per month in PSI inspection fees, the client gained over $7,000 in net profit improvement per month. Annualized, that is approximately $84,000 in recovered margin. This is the direct financial return of pre-shipment inspection benefits in a real e-commerce scenario.
Case Study 2 — Cosmetic Defects on a Premium Product: Acacia Wood Toilet Paper Holder Inspection
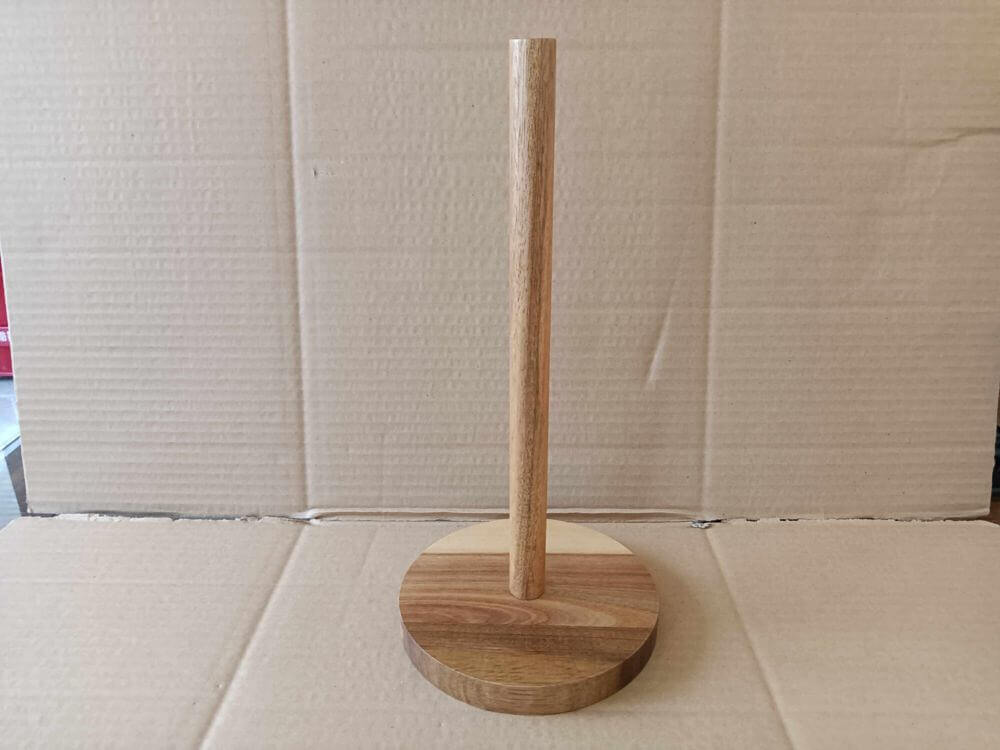
Our second case involves an Amazon seller in the premium home goods segment — acacia wood toilet paper holders. Acacia is prized for its rich grain patterns and hardness, targeting design-conscious consumers at premium price points. The client ships approximately 3,000 units per month with exceptionally tight quality standards. Their biggest concern was not functional defects — it was cosmetic ones. On Amazon, products that 'work fine but look off' often see higher return rates than those with clear functional failures.
When we conducted the pre-shipment inspection, we sampled 125 units per AQL standards. Notably, every functional test passed on the first round — wood moisture content, assembly precision, and 10-degree tilt stability were all within spec. The factory believed they had delivered conforming goods. But our inspectors evaluate from the consumer's perspective — and consumers don't read test reports. They judge what they see the moment they unbox.
Finding #1: Base Panel Edge Chipping — 18.4% Defect Rate
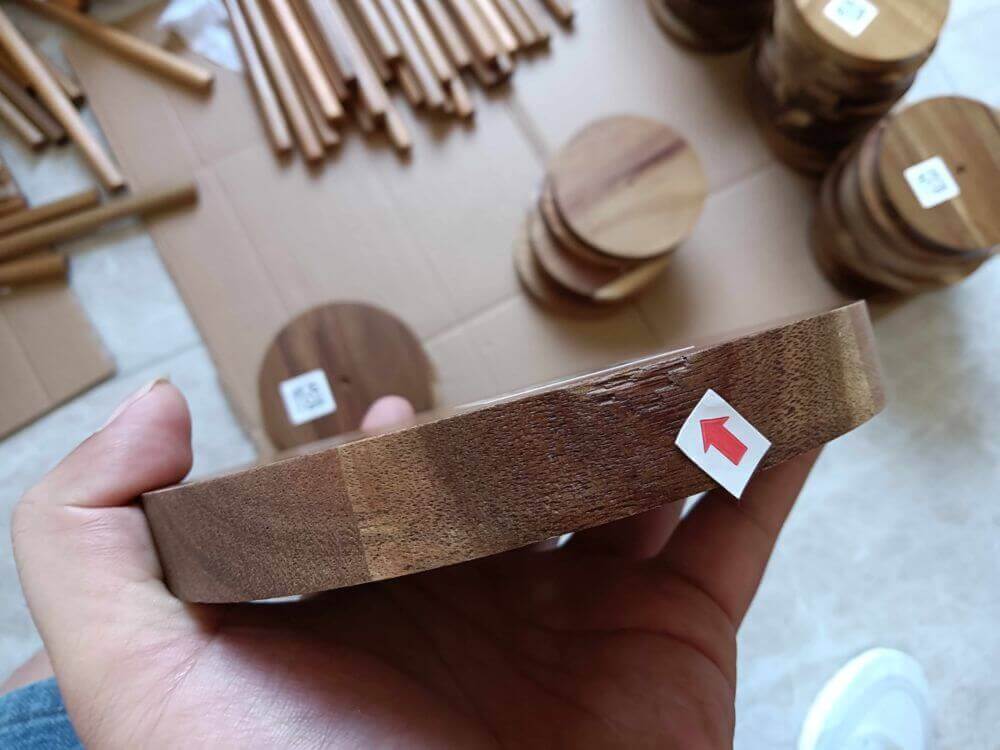
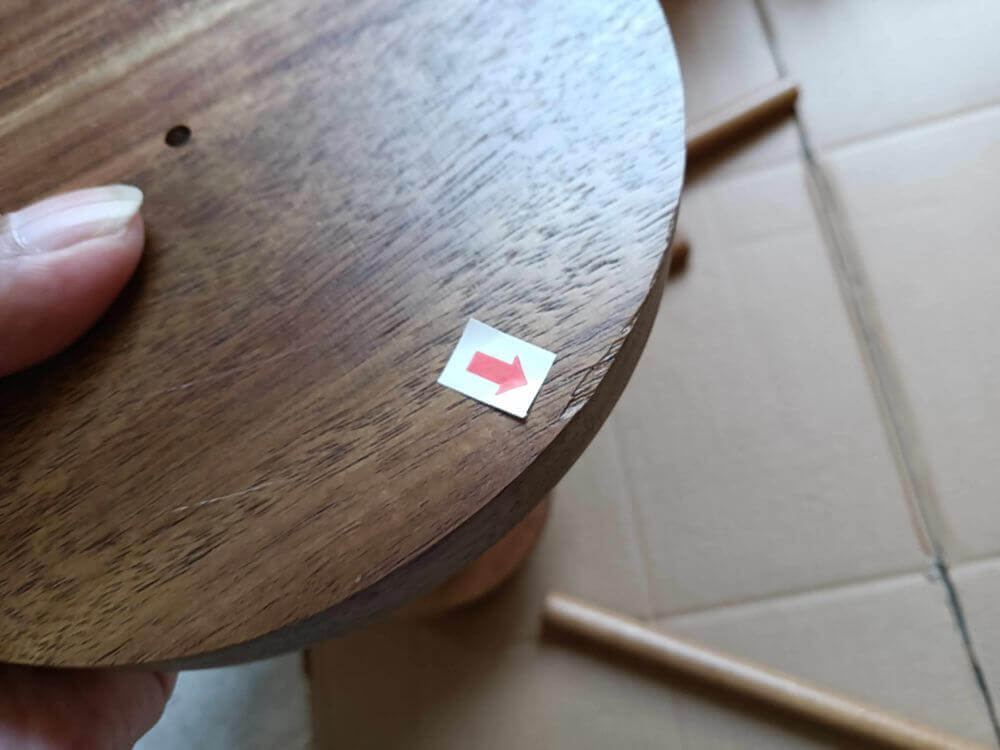
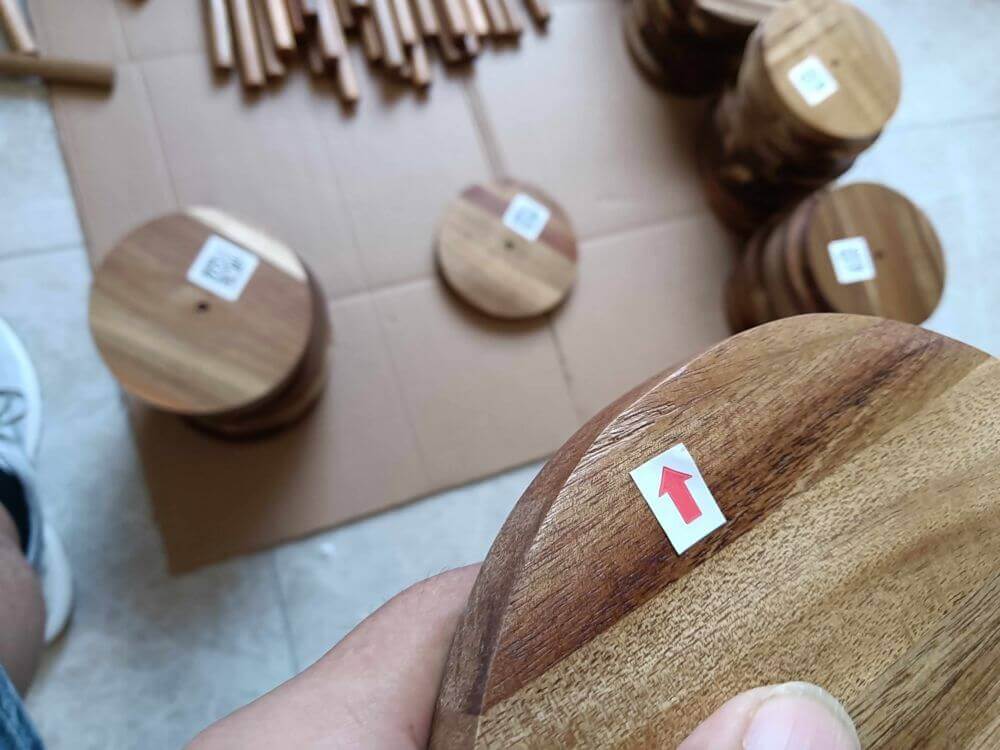
The first issue: edge chipping on the base support panels. Of 125 sampled units, 23 showed chipping of varying severity — a defect rate of roughly 18.4%, well beyond AQL acceptance. The chipping concentrated along the base outer edge; structurally, no impact. But in the premium home category, the base is the first thing a customer sees. A chipped wooden base on a $30+ product translates directly into a negative review and return — consumers don't distinguish between 'cosmetic' and 'quality' defects on premium products. They are the same thing.
Finding #2: Panel Color Variation — Functionally Perfect ≠ Consumer-Ready
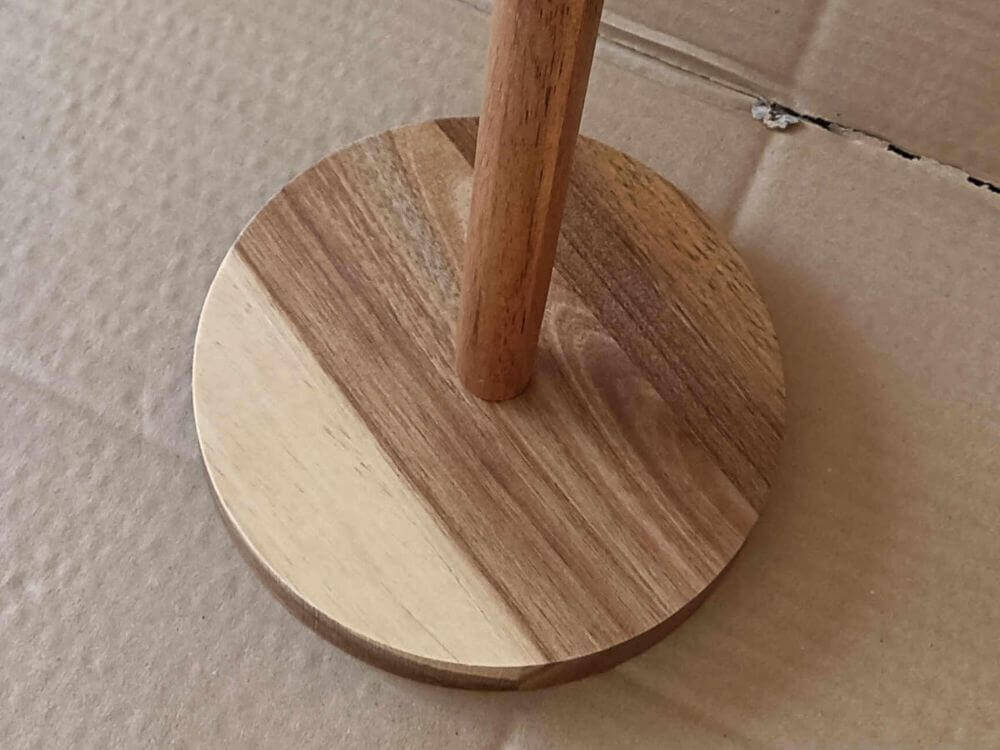
The second issue was panel color variation. The holder is assembled from multiple wood panels, and in affected units the color difference between adjacent panels was stark — one panel reddish-brown, the next yellowish-white. Zero structural impact — the holder mounts, rotates, and bears weight perfectly. But consumers pay a premium for acacia specifically for its warm, natural aesthetic. Two mismatched panels side by side instantly downgrades the product's perceived quality. Ship this to Amazon FBA, and reviews will include phrases like 'looks cheap' or 'not as pictured' — keywords the platform algorithm penalizes aggressively.
All Functional Tests Passed — That Didn't Make the Batch Shippable
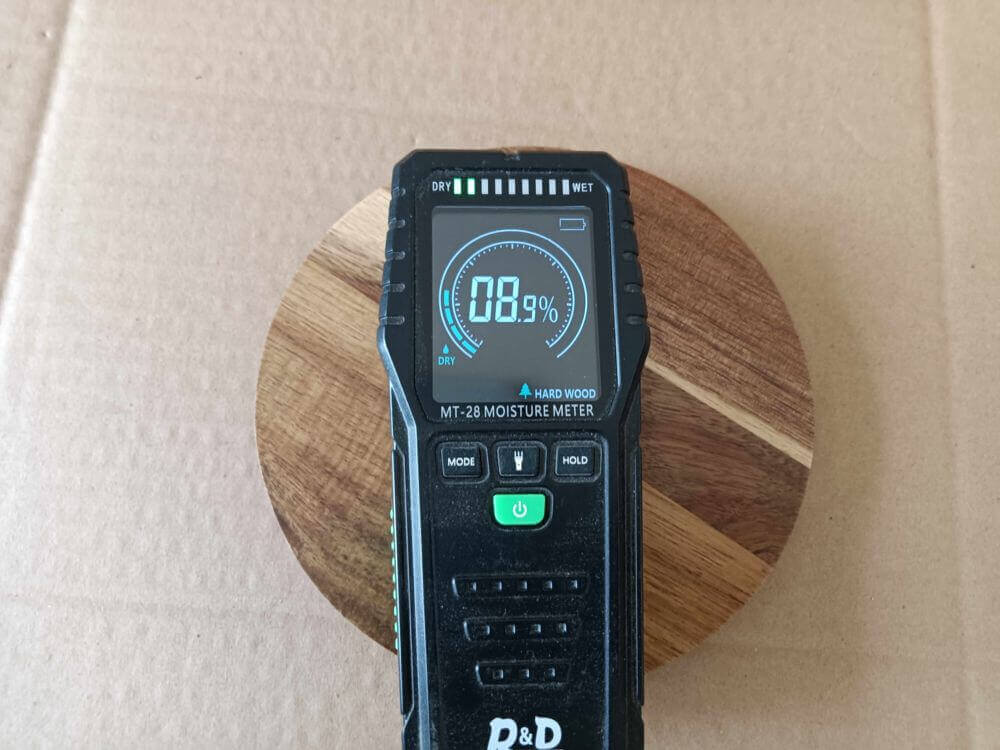
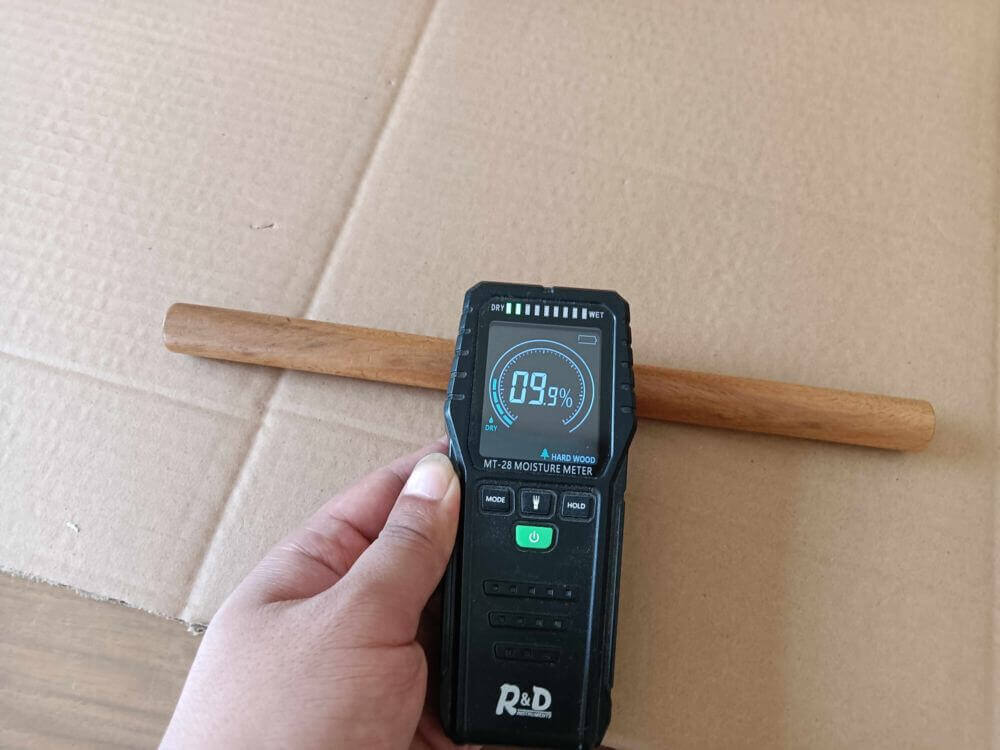
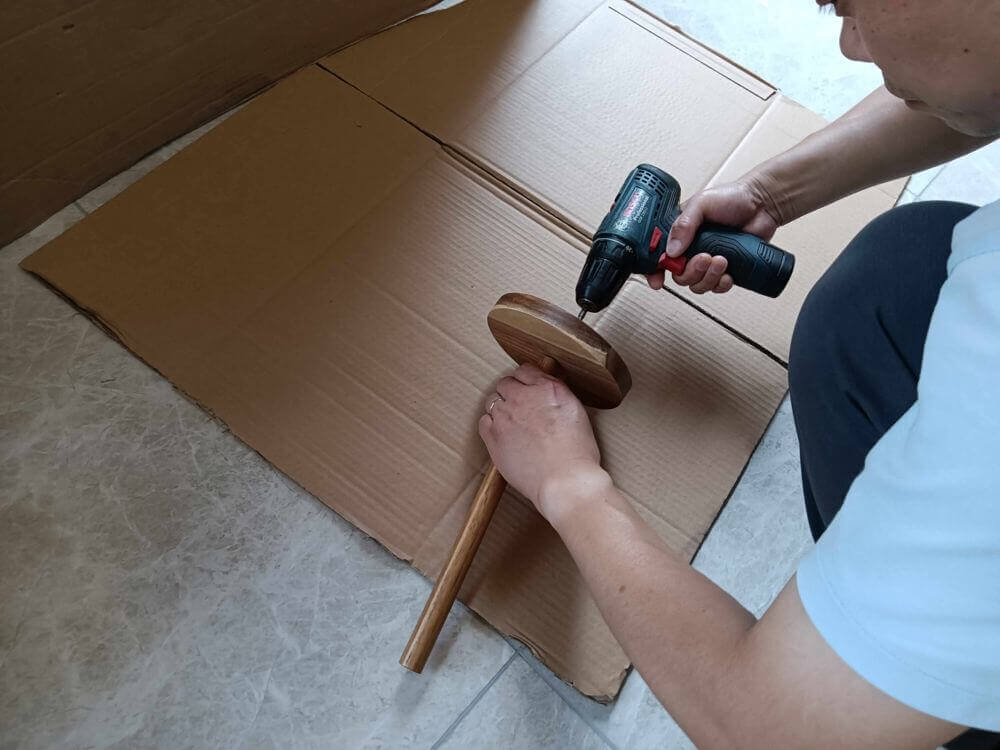
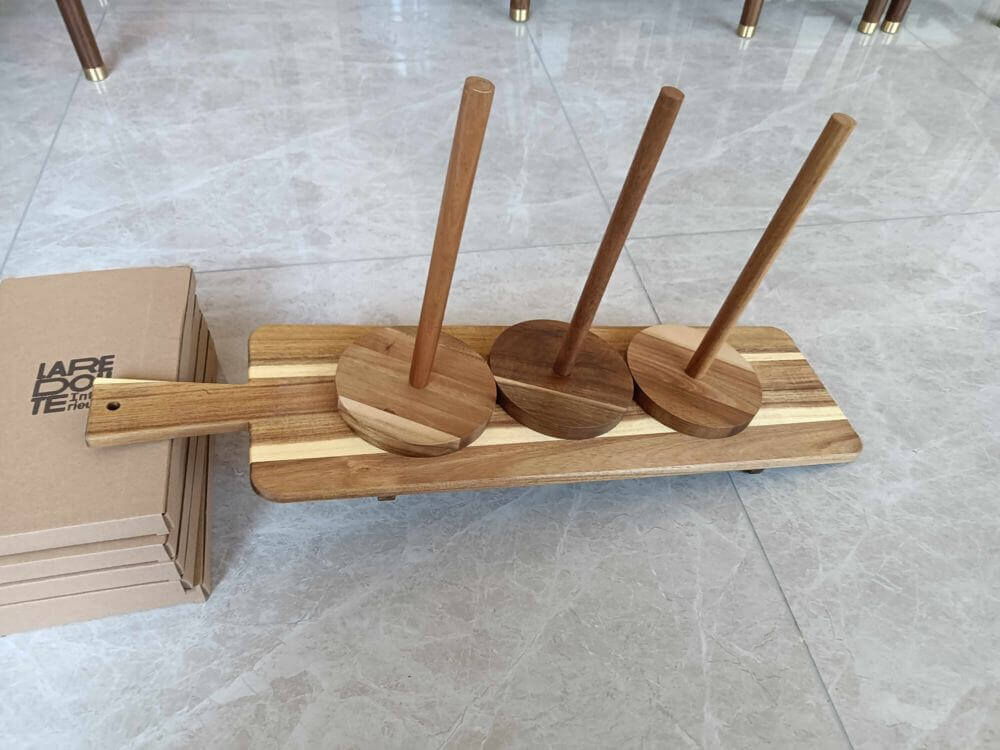
The four images above document the functional testing. Wood moisture content measured 8%–12% — at this level, no post-shipment warping or cracking risk. Moisture testing is a core pre-shipment inspection step for wood products that many factories skip entirely. Assembly precision was flawless, with all hardware matching within tolerance. The 10-degree tilt test — simulating everyday bumps from an arm or towel — showed stable performance across all samples. From an engineering standpoint, this batch was perfect.
But if we had relied solely on the functional test report and released the shipment, what would have happened to those 3,000 units? Consumers don't read moisture reports or tilt-test data — they unbox to find a chipped base edge, mismatched wood panels, and a premium price tag. The result: returns, negative reviews, listing-rank erosion. After reviewing our defect photos, both the client and the factory agreed: shipping this batch directly to Amazon FBA would likely trigger a 15%+ return rate — enough to activate platform quality warnings on a premium listing.
The batch was ultimately rejected for rework: all edge-chipped base panels replaced, and color-mismatched panels re-matched. Total rework cost: approximately $1,200. Compare that to the projected return losses — 450 returns × $30+ per-unit return cost = $13,500+ — before accounting for the long tail of negative reviews. The pre-shipment inspection benefit in this single case: an ROI exceeding 11:1. $1,200 in rework prevented $13,500+ in likely losses.
Two Cases, One Lesson: Functional vs. Cosmetic Defects — Same Solution
| Dimension | LED Smart Lighting | Acacia Wood Holder |
|---|---|---|
| Price Segment | Mid-range ($36) | Premium ($30+) |
| Defect Type | Functional + Cosmetic | Purely Cosmetic |
| Factory Self-Check Verdict | Pass (uncalibrated equipment) | Pass (functional only) |
| PSI Findings | Color temp drift, packaging, coating defects | Edge chipping (18.4%), panel color variation |
| Return Risk | 12% (actual) | ~15%+ (prevented) |
| Outcome After PSI | Reduced to 2.8% | Batch blocked, zero returns |
| ROI | >10:1 (monthly) | >11:1 (single batch) |
The conclusion from both cases is straightforward: whether defects are functional or cosmetic, factory self-inspection has systematic blind spots. In the LED case, it was uncalibrated equipment. In the acacia wood case, it was a functional-only checklist that ignored appearance. Both blind spots lead to the same outcome: returns, negative reviews, and profit erosion. Pre-shipment inspection solves both with the same methodology — independent, objective evaluation from the consumer's perspective, not the factory's.
Why In-Factory Self-Inspection Is Not Enough
If factories have their own QC staff, why did they miss the color temperature deviation? The answer is incentive misalignment. A factory QC inspector's priority is 'meet the shipment deadline,' not 'delight the end consumer.' Their instruments may be out of calibration, and their tolerance thresholds may not match the brand's specifications. In the LED lighting case, the factory's integrating sphere had not been recalibrated for six months. This is precisely where independent third-party inspection services provide irreplaceable value.
"Factory self-inspection cannot replace independent third-party inspection. Incentive conflicts, aging equipment, and inconsistent standards compound to create systematic blind spots in quality control."
Which Products Benefit Most from Pre-Shipment Inspection
Based on CNQ's aggregate inspection data, the following product categories see the most significant return-rate improvement from pre-shipment inspection:
- Electronics & Smart Home — Functionality defects, firmware version mismatches, and color/lumen inconsistencies are the top return drivers.
- LED Lighting — Color temperature, CRI, and luminous flux deviations from labeled specifications are extremely common.
- Furniture & Home Goods — Assembly misalignment, surface scratches, and missing hardware directly impact the unboxing experience.
- Toys & Children's Products — Safety compliance failures not only cause returns but can trigger platform delisting and legal liability.
- Textiles & Apparel — Color variance, sizing deviation, and label-content mismatch are the most frequent return causes.
Pre-Shipment Inspection vs. Alternative QC Approaches — Cost Comparison
| Approach | Cost per Batch (Est.) | Defect Discovery Stage | Correction Cost Multiplier |
|---|---|---|---|
| Pre-Shipment Inspection (PSI) | $188 | Before Shipment | 1x (baseline) |
| Initial Production Check (IPC) | $188 | Early Production | 1.5x |
| During Production Inspection (DPI) | $188 | Mid-Production | 2x |
| Factory Self-Inspection Only | $0 (direct cost) | Post-Shipment / On Return | 10x – 30x |
| Amazon Return Analysis (Reactive) | $0 (direct cost) | After Consumer Return | 10x – 30x |
The table above makes the cost advantage clear. A single $188 pre-shipment inspection can prevent $2,000 to $5,000 in return-related losses. For sellers shipping over 3,000 units per month, PSI typically delivers an ROI of 10:1 or higher.
How to Start Pre-Shipment Inspection for Your Supply Chain
If you sell China-sourced products on Amazon or other platforms, we recommend the following steps to implement pre-shipment inspection:
- Define Your Inspection Criteria — Specify critical quality parameters (color temperature, functionality, packaging) and acceptable tolerances.
- Communicate with Suppliers — Include PSI terms in your purchase agreement so the factory understands inspection criteria and consequences upfront.
- Select an Inspection Partner — Choose a third-party inspection provider with proven experience in your product category.
- Start with High-Return SKUs — Prioritize the products with the highest return rates rather than trying to cover everything at once.
- Track Data and Iterate — Compare monthly PSI defect findings against actual return rates and continuously refine inspection focus areas.
For buyers unsure where to start, try our inspection cost calculator to estimate per-batch fees. In most cases, a single PSI inspection pays for the entire quality control program within the first month. Use the Inspection Cost Calculator to estimate your per-batch fees.
Disclaimer: The case data in this article is based on actual CNQ inspection projects with anonymized client details. Return-rate improvements vary by product category, supplier quality, and inspection frequency. We recommend a professional third-party inspection to evaluate your specific supply chain situation.